
Workflow VisibilitySee Where Cases StallAnd Why
Clinical workflows are complex. Cases move through 10+ stages, across multiple teams and vendors, with SLA clocks ticking at every step. Operon gives you a live view of where cases stall, which ones are at risk, where rework concentrates, and which SLAs are about to breach - so your team can act before problems become compliance failures.
Built for health plans and the clinical operations teams running them.
Find Friction Before It Finds You
The Control Tower surfaces where cases stall, which stages consume the most time, where rework concentrates, and which SLAs are at risk, across every entity and workflow stage.

* Actual product screenshot from the Operon.Cloud platform
Friction Matrix
Heatmap of cases visited, rework touches, AI automation rates, active time, and dwell time by workflow stage.
Time & Touch Hotspots
See where calendar time and human touches concentrate so you can target the stages that slow cases down the most.
SLA Exposure Profile
Track SLA budget utilization and breach risk by stage, sorted by total dormant and delay state consumption.
Rework & Automation
Measure rework loops, repeat touches, and AI vs non-AI automation rates to identify where automation is working and where it isn't.
Predict Risk Before It Becomes a Breach
Operon's Risk AI goes beyond diagnostics. It predicts which in-flight cases are most likely to miss their SLA, so your team can intervene while there's still time. No more finding out from last month's report.
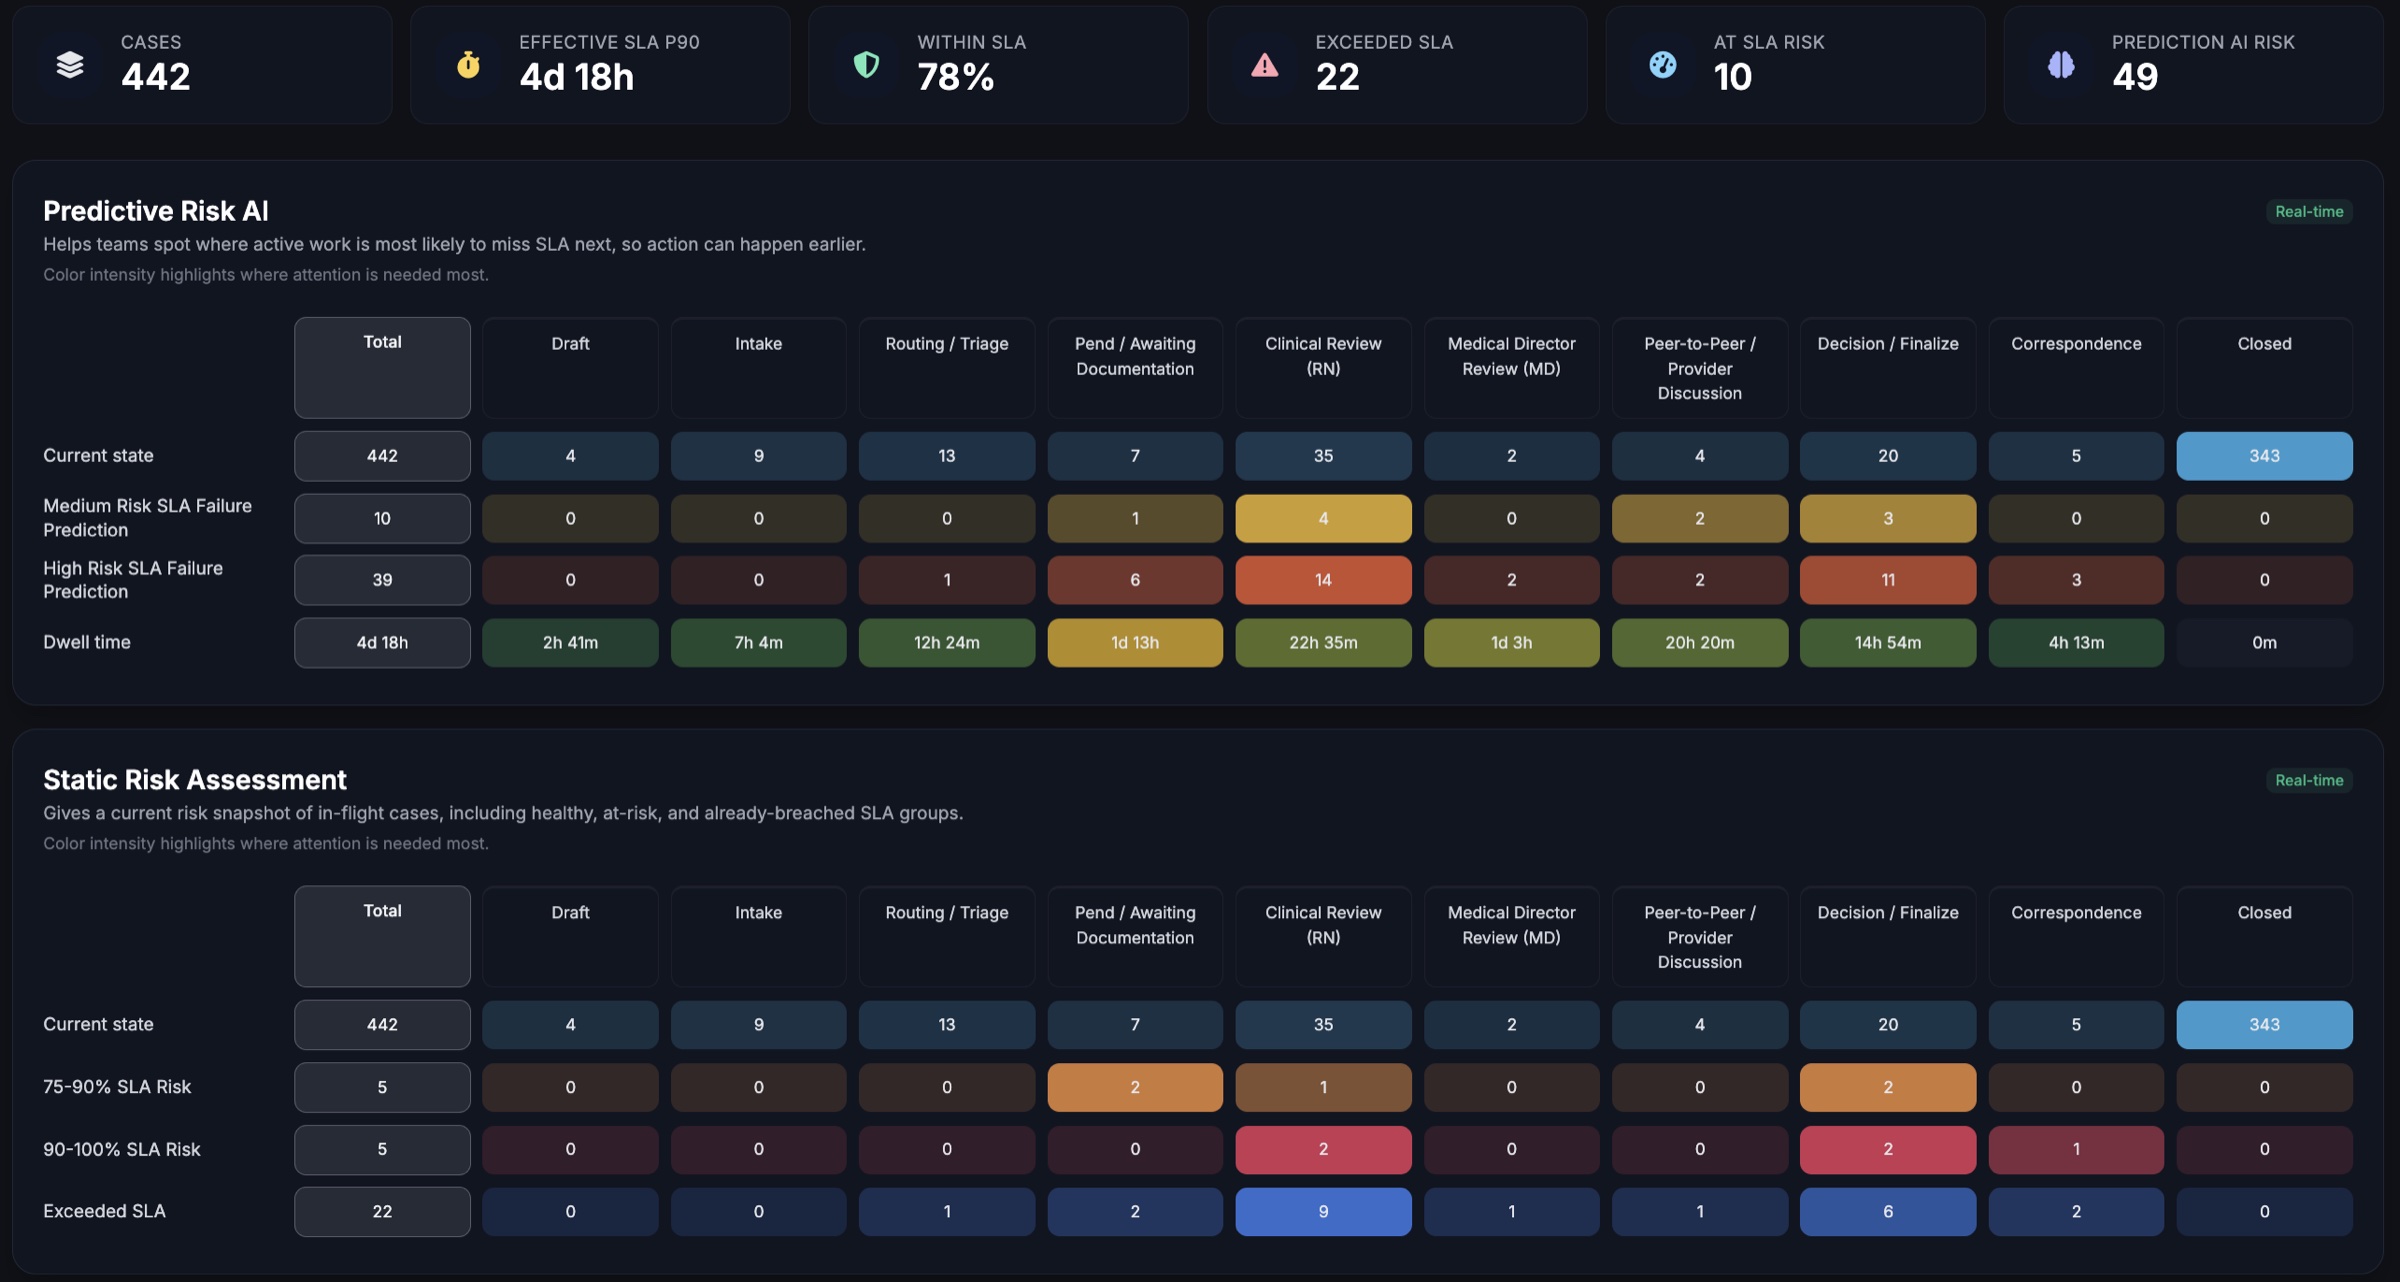
Predictive Risk AI
ML-driven prediction of which active cases are most likely to miss SLA next, by workflow stage. Color intensity highlights where attention is needed most.
Static Risk Assessment
Real-time snapshot of in-flight cases: healthy, at-risk (75-90% SLA budget consumed), near-breach (90-100%), and already-exceeded, across every stage.
Dwell Time by Risk Tier
See how long at-risk cases have been sitting at each stage, so you can prioritize by urgency.
Stage-Level Risk Heatmap
Instantly see which workflow stages are accumulating the most predicted failures. Your signal to reallocate resources now.
Trace Every Loop. Quantify Every Minute.
See which interactions repeat, where rework concentrates, and how much time and money each loop costs, so you can eliminate waste and prove improvement.

* Actual product screenshot from the Operon.Cloud platform
Time-Study Matrix
Heatmap of cases visited, rework touches, time-study baselines, and estimated improvement potential by workflow stage.
Loop Rate & Repetitions
Identify which interactions loop most often and how many times cases cycle through the same step before resolution.
Time Burden
Measure the total hours consumed by each interaction and rework loop to pinpoint where operational time is lost.
Cost Burden
Translate rework loops and repeat touches into dollar cost per interaction so you can prioritize fixes by financial impact.
Process Visibility Is Half the Picture
You know where cases stall and which ones are at risk. Now see who's handling the work, what each touch costs, and whether your operating model is efficient. That's Cost & Performance.
Explore Cost & PerformanceStop Finding Problems in Last Month's Report
No pitch deck. No pressure. Just a conversation about what you're trying to solve and whether we're a fit.
Good fit if you're:
- Running clinical workflows and can't see where cases stall or why
- Managing multiple vendors and teams with no unified performance view
- Losing SLA compliance with no early warning system
- Looking for live operational visibility across your clinical workflows
Book a Call
- 30 minutes with our founding team
- Discovery, not a demo
- Honest assessment of fit
Or email us at sales@operon.cloud