
Cost & PerformanceSee Who Does WhatAnd What It Costs
Health plans run complex operating models: internal teams, delegated vendors, AI automation - all handling cases across the same workflows. But nobody has a unified view of who’s doing what, how they’re performing, and what each touch actually costs. Operon gives you a live performance view of your entire workforce, so you can staff smarter, hold vendors accountable, and understand the true cost of every case.
Built for health plans and the clinical operations teams running them.
Measure Every Resource . By Output, Not Hours.
The Resource Leaderboard ranks every resource by actual throughput, handle time, pickup speed, and a composite performance score. See who's your highest performer, who's falling behind, and where coaching or reallocation is needed , based on data, not opinion.

* Actual product screenshot from the Operon.Cloud platform
Performance Score
Composite score combining throughput, handle time, and pickup speed. Instantly identify top performers and underperformers across your workforce.
Throughput Metrics
Touches per day, total cases handled, and average handle time per resource. See actual productivity, not just hours logged.
Pickup Wait
Average time from case assignment to first touch. The leading indicator of resource responsiveness, critical for SLA-sensitive workflows.
Workforce Type Tags
Every resource tagged as human/AI, internal/external. Filter and compare performance across workforce segments to evaluate vendor vs. internal efficiency.
See Every Case, Every Stage, Every Owner
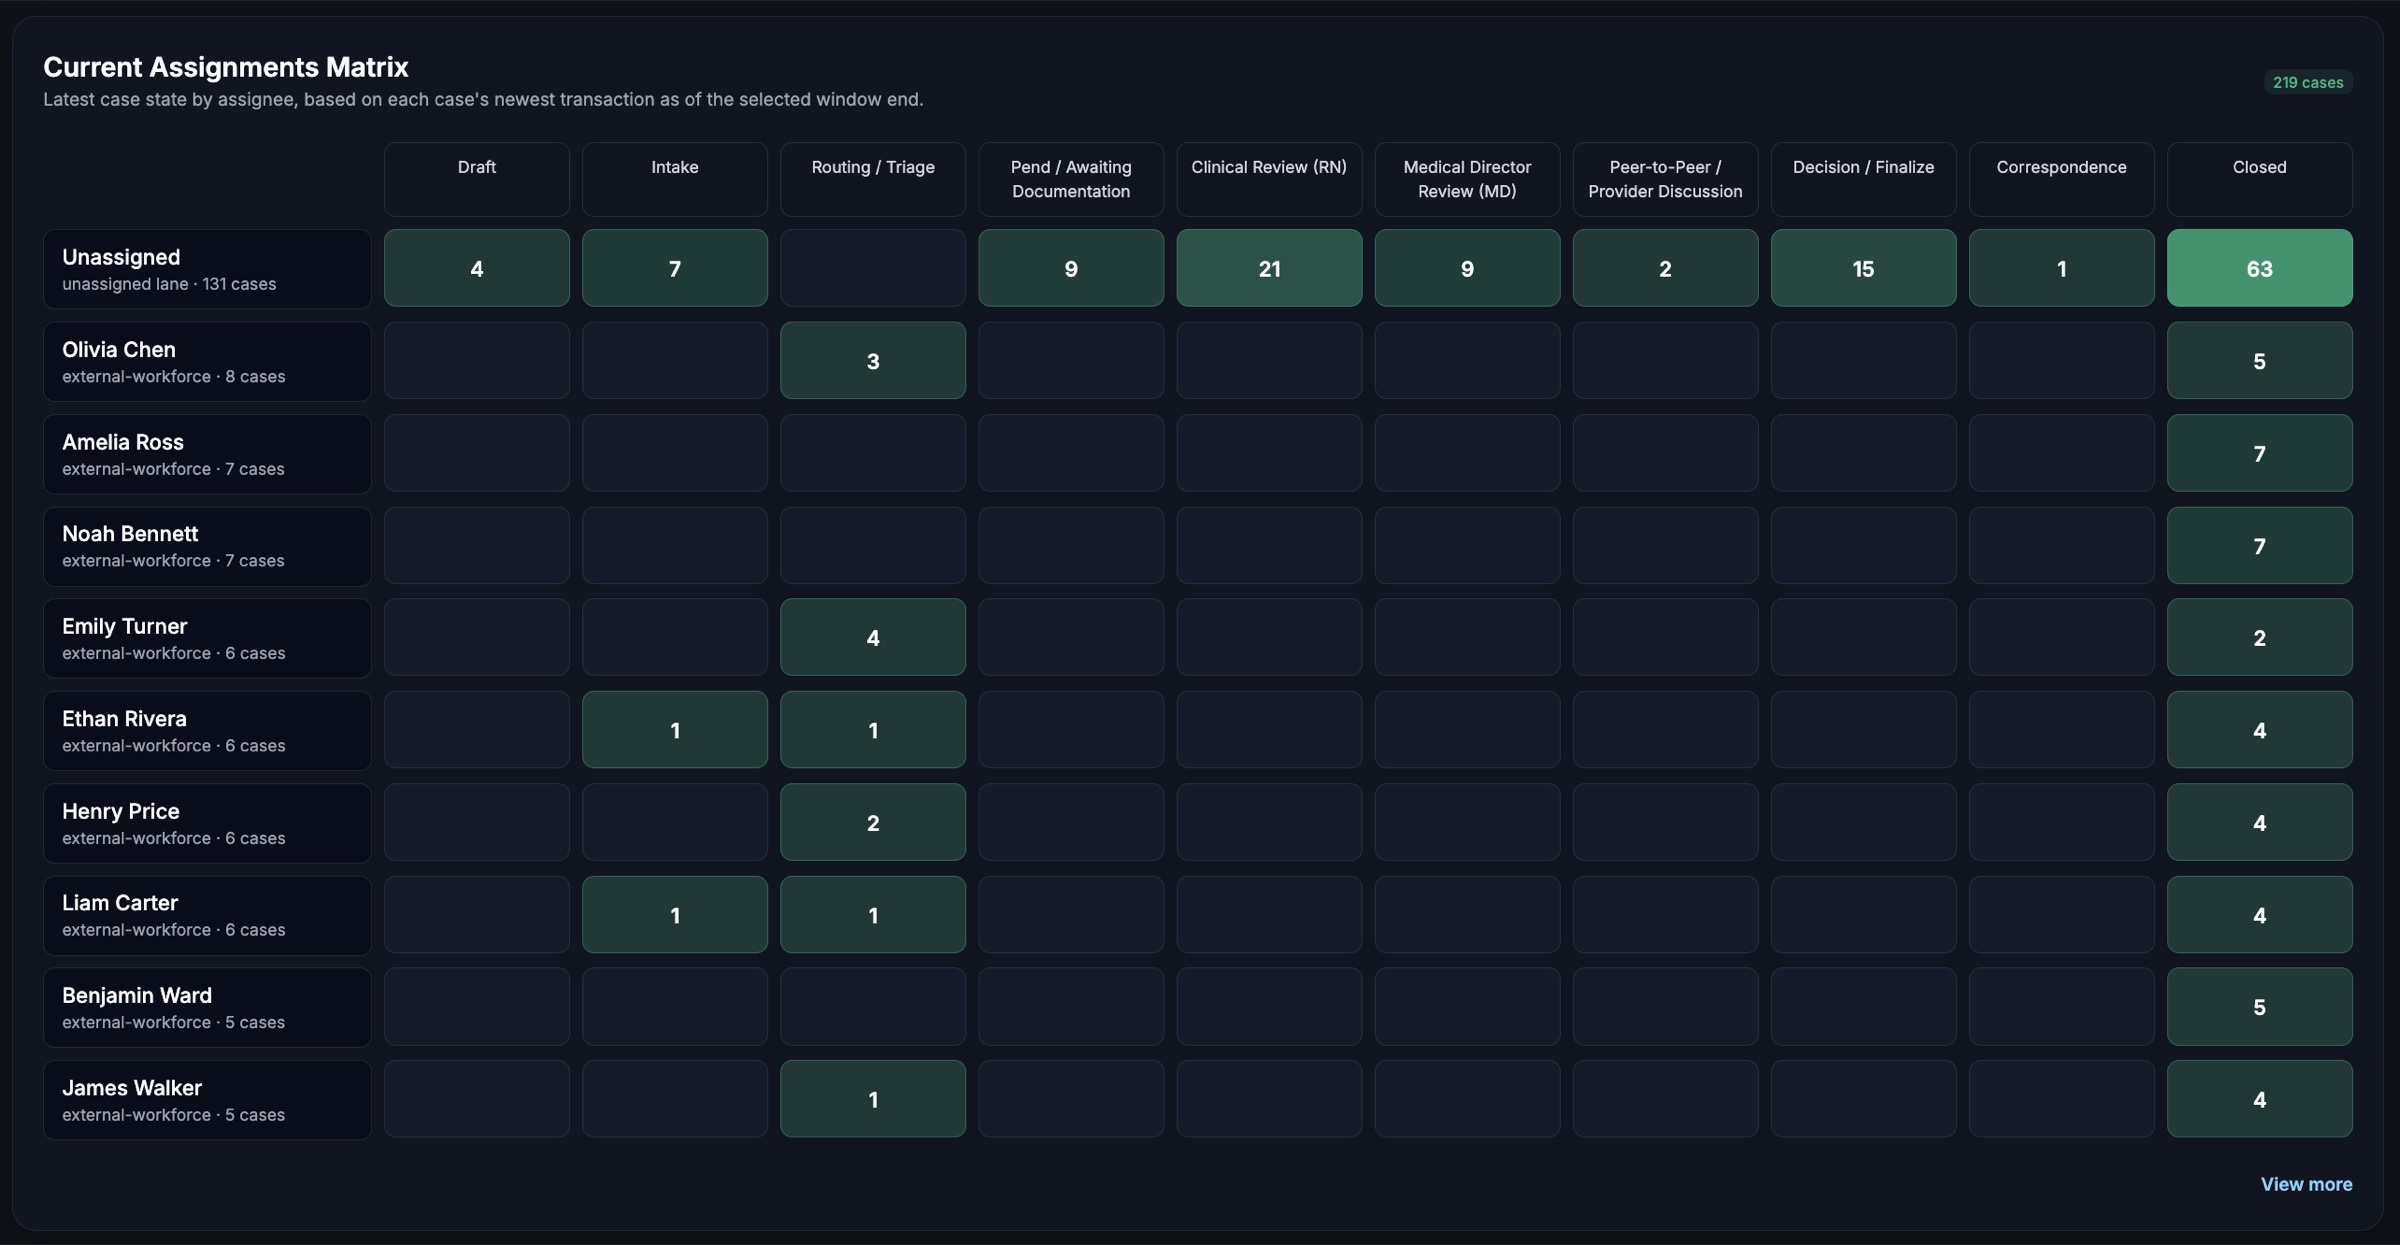
The Current Assignments Matrix shows you the latest case state by assignee: who owns which cases at which workflow stage, right now. Instantly spot the unassigned lane (cases with no owner), see which resources are concentrated in which stages, and identify bottleneck ownership patterns.
* Actual product screenshot from the Operon.Cloud platform
56% of active cases have no assigned owner
139 of 247 cases are sitting in the unassigned lane: 71 in Closed, 21 in Clinical Review. This is the kind of operational blind spot that causes SLA breaches and accountability gaps. The Assignments Matrix makes it impossible to hide.
Unassigned Lane Visibility
Instantly see how many cases are sitting without an owner, and at which stages. The single most actionable resource metric for clinical ops.
Stage-Level Ownership
See which assignees own cases at each workflow stage. Identify whether the right people are handling the right work at the right time.
Internal vs. External Workforce
Distinguish between internal staff and external/delegated workforce. See how case ownership distributes across your vendor ecosystem.
Know Where Every Resource Is . Right Now.
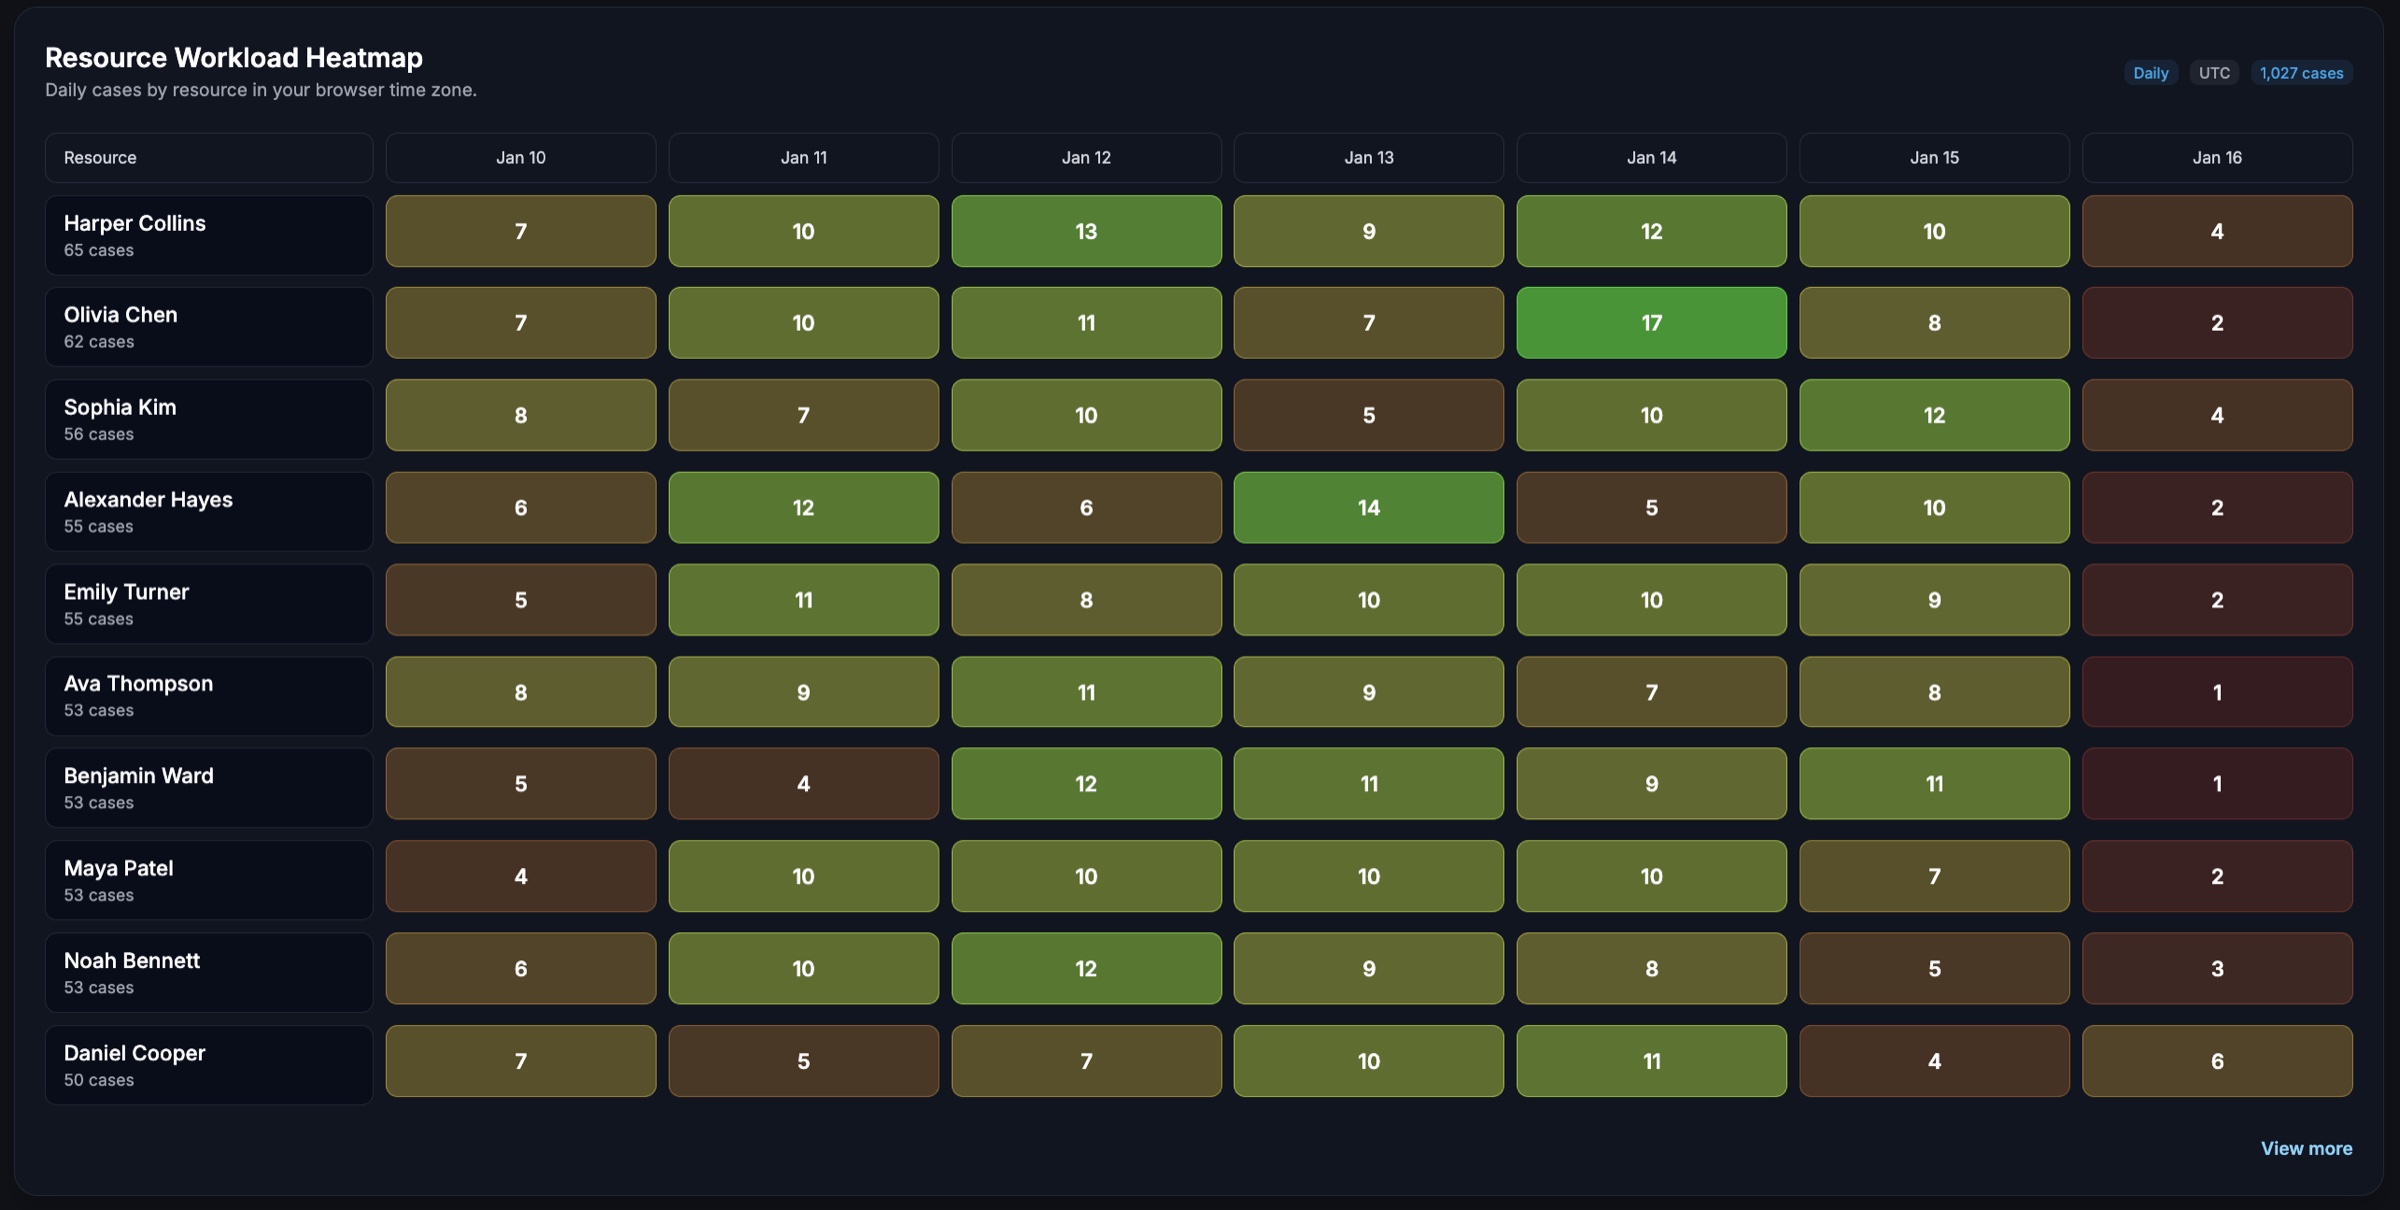
The Resource Workload Heatmap shows daily case volume by resource, color-coded by intensity. See at a glance who's overloaded, who has capacity, and how workload distributes across your team day by day. No more guessing who's busy. The data is live.
* Actual product screenshot from the Operon.Cloud platform
Resource Workload Heatmap
Daily case volume by resource with color-coded intensity. Spot overloaded team members, uneven distribution, and capacity gaps at a glance, across any time window.
Daily/Weekly Trends
Toggle between daily and UTC views. See how workload shifts over time, identify peak days, and plan staffing around actual demand patterns.
Resource Filtering
Filter by team, vendor, role, or workforce type (internal vs. external) to see workload distribution within any segment of your operating model.
See Where Cases Break
Your operating model is only as good as your workflows. Workflow Visibility shows you where cases stall, which ones are at risk, and where rework concentrates.
Explore Workflow VisibilityProve What AI Is Delivering
You've deployed AI across clinical workflows. Cost & Performance shows you who's doing the work. AI Adoption & ROI shows you whether the AI is actually saving time and money.
Explore AI Adoption & ROIStop Guessing What Your Operations Cost
No pitch deck. No pressure. Just a conversation about what you're trying to solve and whether we're a fit.
Good fit if you're:
- Managing multiple vendors and teams with no unified performance view
- Can't answer "who handles what, at what cost?" without a spreadsheet
- Running delegated operations and need vendor accountability data
- Seeing SLA breaches caused by staffing blind spots, not process gaps
Book a Call
- 30 minutes with our founding team
- Discovery, not a demo
- Honest assessment of fit
Or email us at sales@operon.cloud